


What if the number one question asked by your leadership team wasn’t “who is responsible for this transportation delay,” but rather “what does the data show”?
It’s a situation we’ve heard a million times: A discharge is ready. The bed is needed. But the truck didn’t show up when it was supposed to, so the patient stays another night, the bed stays full, and no one is happy about it (especially the patient).
In most hospitals, this is where the conversation about transportation gets stuck. Case management sees a transportation partner who didn’t show up on time while EMS and transportation providers see a hospital that failed to give any lead time for when a ride would be ready. Both sides are working toward the same goal—moving patients safely and on time—but without shared visibility, each team only sees its half of the story. Trust erodes, throughput slows, and the real transportation bottlenecks stay hidden.
There’s a more productive way to run this relationship, and it starts with reframing transportation as a shared, measurable process rather than a hand-off between adversaries. At the American Case Management Association (ACMA) 2026 National Conference, two leaders from Brown University Health showed what that reframing looks like in practice. Learn how Alicia Corey, Director of Case Management, and Nelson Pedro, Manager of Capacity and Flow used transportation data turned a potential source of conflict into a partnership built on transparency and accountability.
Ultimately, transportation is an essential part of the discharge process. Using data is the best way to build a partnership between case management and EMS to eliminate bottlenecks and ensure your patients are being moved on time.
Why Transportation Becomes a Blame Game
Transportation friction is rarely the result of one team failing to do their job. But when there’s no shared perspective, each team can only see what’s visible within their silo.
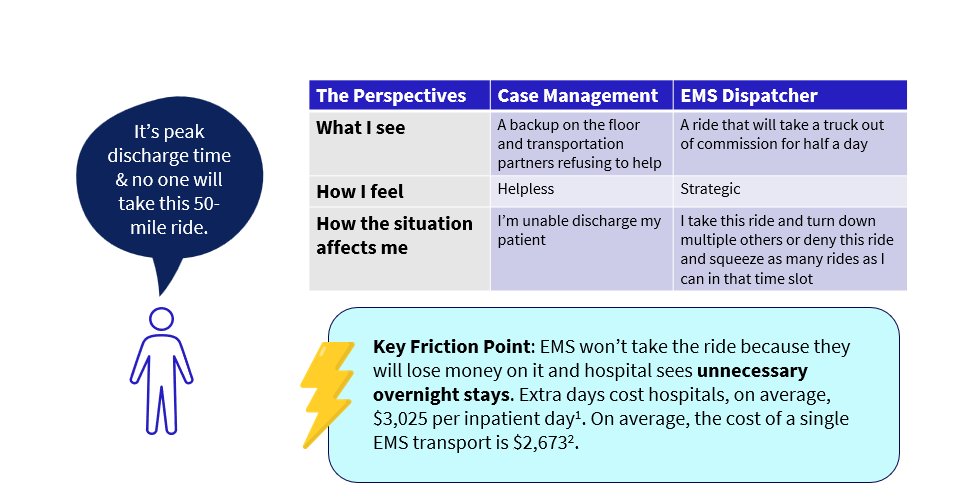
Take a scenario familiar to anyone who has managed a discharge: it’s peak discharge time, and no one will take a 50-mile ride. From the case manager’s POV, this can often look like a transportation partner refusing to help and a bed that remains filled. From the dispatcher’s chair, this scenario looks like a ride that pulls a vehicle out of commission for half a day, forcing that EMS agency to turn down several closer, more profitable trips in the meantime.
Both perspectives are rooted in real, lived experience – except that experience only happens to be one half of the picture. When there is no visibility into or communication about the other team’s constraints, it makes sense that both groups can be defensive. But the fallout results in delayed discharges and avoidable costs on both sides.
Why the Pressure on Transportation Is Rising
This standoff isn’t unique to Brown, and it’s getting harder to break as a few shifts across healthcare raise the stakes on getting transportation right:
- Centralized throughput: Hospitals are consolidating throughput initiatives, hunting down the inefficiencies that quietly extend length of stay. One system centralized oversight across a dozen campuses and saw ED holding times for patients awaiting transportation drop by nearly half.
- Multi-provider networks: Health systems are moving away from single-vendor transportation relationships, which create a single point of failure and a one-sided power dynamic, and toward networks that spread volume and risk across several partners.
- Dedicated transportation coordination roles: Case management teams need to focus on top-of-license care, and are subsequently building specialized roles to absorb the administrative load transportation coordination creates.
“We really want to make sure that transportation is never a reason why there’s a delay,” Alicia Corey adds. So when understanding transportation bottlenecks became mission critical for Brown, case management and EMS turned to their transportation data for answers. “We’ve done a lot of work looking at data to make sure that transportation is never the reason why a patient is staying longer in the hospital.”
One thing that was clear? When there wasn’t a shared source of truth between both sides of the house, those visibility gaps were filled with unproductive assumptions. Nelson Pedro, a paramedic before he transitioned into a hospital flow and capacity leader, credits transparent data for the dismantling of years of mutual suspicion between EMS and case management.
“We were all pointing the finger at the other person, and we’re really all responsible for the proper discharge of a patient, including the ambulance companies and including the hospital.”
— Nelson Pedro, Manager of Capacity and Flow, Brown University Health
Making the shift from behavior assumptions to data-based improved requires more than a few dashboards. It’s important to see the whole journey and capture key datapoints across the entire transportation lifecycle in order identify points of failure.
A Framework for Measuring the Transportation Lifecycle
Pedro and Corey leveraged a full transportation lifecycle framework to break down discharge and interfacility transfer transportation into discrete, measurable steps between the decision to move a patient and said patient’s departure, so a delay can be traced to its actual source, rather than assigned to the nearest target.
Each stage has a timestamp, and each timestamp tells you something different:
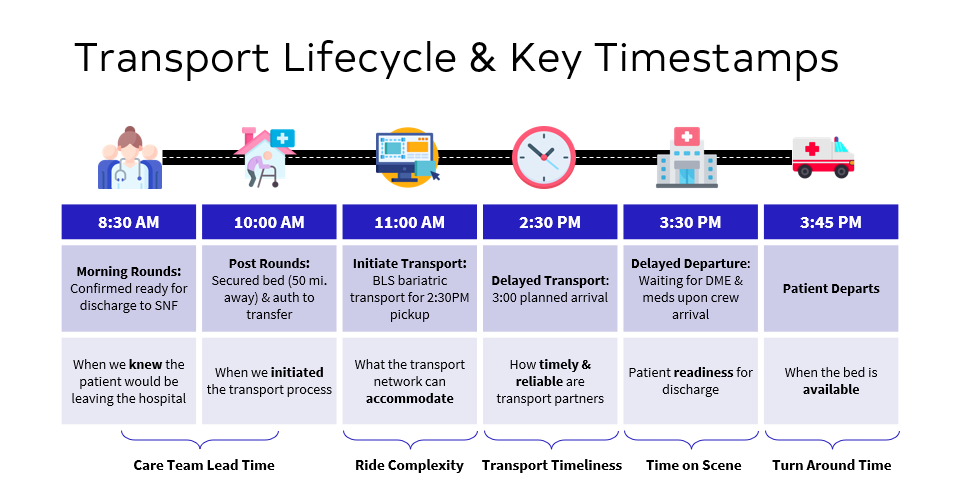
- Care team lead time: The gap between knowing a patient is ready (morning rounds) and initiating the transport request. Shortening this gap ultimately maximizes your lead time, which gives your transport network as much time as possible to prepare.
- Ride complexity: Data and trends around certain ride complexities may indicate bottlenecks to discuss between hospital and EMS stakeholders. Common complexities include mileage, bariatric needs, multiple drips and devices, payer mix, and peak discharge times.
- Transport timeliness: The overall measurement of a transportation network’s ability to meet committed pick-up times.
- Time on scene: Time on scene timestamps can help indicate whether there is are patient readiness challenges within the hospital or where there might be inefficiencies after a crew arrives on scene.
- Turnaround time: This timestamp can be used to assess how quickly the bed is turned over and ready for the next patient.
This framework turns “transportation is a mess” into specific, answerable questions: which stage, which ride type, which provider, and how often are there delays?
Using Transportation Data to Fix Discharge Delays
A framework is only useful if it actually changes behavior. The most instructive part of Brown University Health’s experience is how specific metrics led to direct operational changes. Here’s one real-life example shared by the team. A patient set to discharge to hospice was documented ready at 2 pm, but the ambulance wasn’t booked until 4:30, with a 5 pm pickup. By the time EMS arrived at 5:30 pm, the hospice nurse scheduled to meet the patient at home was gone and the patient was stuck in the hospital, filling the bed, for another night.
For years, a delay like that would have been chalked up to a slow ambulance crew. The data showed something different: the two-and-a-half-hour gap sat entirely before the ride was booked and EMS was ever notified.
Seeing where the gap actually sat changed Brown’s process. “Previously we were waiting for a discharge order to be in before we could schedule an ambulance. Now we’ve flipped that,” Corey shared. The team now tracks the time between a written discharge order and the moment a ride is actually requested, alongside overall lead time, and flipped its booking workflow to close that gap. “Case management will set the time and give providers and nursing at least two hours to get their paperwork in so we can schedule the ambulance two hours ahead. We’re not waiting until half an hour before the patient is ready to leave.”
The same logic runs across the rest of the lifecycle. Fulfillment rate and lead time show which complex or long-distance rides go unfilled and why, letting hospitals book a day or two ahead. This also allows EMS agencies to plan a return trip instead of turning down a one-way haul where they would eat the cost. A proactivity score, defined as the share of rides booked with at least 90 minutes of notice, keeps that lead time visible by unit and by user. On-time performance and time on scene separate a provider’s lateness from a patient who wasn’t ready.
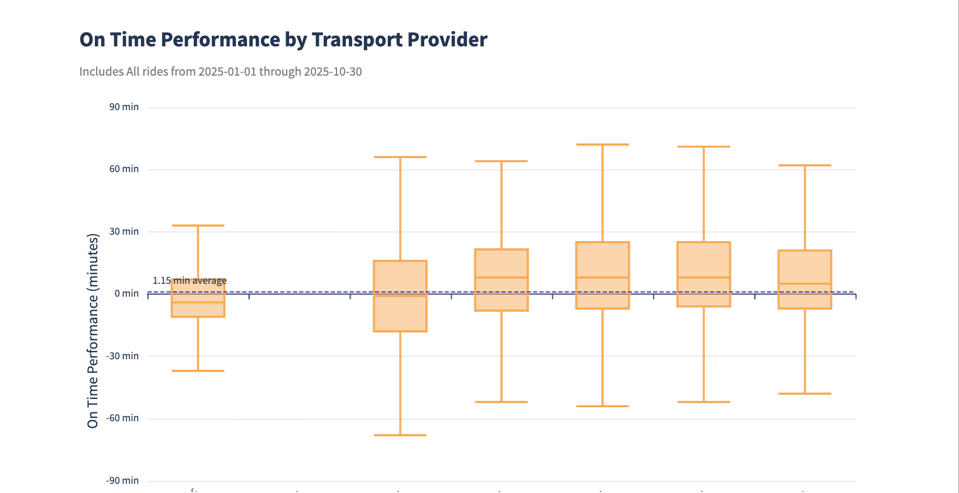
On-time performance and time on scene together changed how Brown talks to its transportation providers. Instead of relaying complaints over the phone, Pedro brings objective on-time performance data to monthly meetings with his providers, framed as a business partnership review.
“Data speaks for itself when you present the real facts… You stop presenting the data and basically let them know they can’t handle the volume, and give them an opportunity to fix that. I would say 90% of the time they have corrected in one way or another—brought on extra crews, extra staffing. They get excited to meet with me to see where their data lies. We’ve never gotten rid of a service.”
— Nelson Pedro, Manager of Capacity and Flow, Brown University Health
Capture every step of your transportation lifecycle in one place.
Using data to create a common ground only works if you have reliable information. Brown University Health uses Roundtrip to accurately capture transportation metrics at every step of the transportation lifecycle, so they can make data-informed decisions if bottlenecks arise.
If you want to learn how to do more with the data you collect, schedule 15 minutes to talk with our team.
Why Collaboration Matters Just as Much as the Data Itself
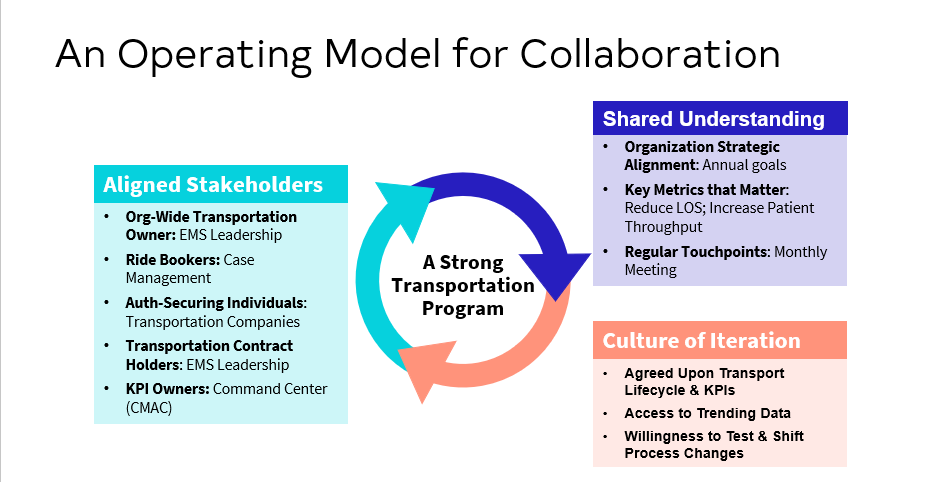
A dashboard cannot run a meeting or change a policy on its own. Real progress at Brown came from treating data as the start of an ongoing process, not something pulled out to win a single argument.
That means aligning all transportation stakeholders, level-setting on the metrics that have the most operational impact and who owns them, and committing to a cadence of reviewing these numbers together and testing changes. It’s a culture of iteration that has takes time to grow and develop. Nelson Pedro has spent 20 years at Brown University Health, but the data partnership with case management didn’t start until the fall of 2019. Before that, by his own account, he and Alicia Corey weren’t exactly on the same side of the table. Now, there’s a shared understanding and alignment on what matters.
“When you’re under a lot of pressure, length of stay, decrease length of stay, it’s very easy to start finger pointing. Transport didn’t show up. Case management wasn’t ready… Just focusing on the data and using it collaboratively, versus focusing on what someone else is doing wrong—that’s been key for us.”
— Alicia Corey, Director of Case Management, Brown University Health
The Partnership Behind Better Patient Flow
Transportation sits at the very end of the discharge process which comes with it’s own unique set of challenges. It’s easy to treat the final leg of a patient’s journey as someone else’s problem, and it’s incredibly costly to your health system when something goes wrong. An unreliable ride delays discharges, extends stays, holds beds, and frustrates the clinical teams trying to keep patients moving.
Treating transportation as a shared process that can be measured and building a partnership around that data completely shifts organizational culture and the bottom line.
If you’re not sure where to get started, here are a few questions that can start closing the gap between EMS and case management:
- How much lead time are we actually giving our transportation partners—and do we know, or are we guessing?
- When a discharge slips, can we tell whether the delay happened in our building or on the road?
- Do we bring data to our transportation partners, or complaints?
- Who owns the transportation metrics that matter, and when do we sit down together to review them?
Getting started can be as simple as getting to know your EMS and/or case management counterparts and starting to understand the challenges they face and what problems they are trying to solve. Investing in transparent relationships make it easier to identify the metrics that can move the needle and make it possible to lay the groundwork for using that data to manage the hard conversations.
Ultimately, health systems that can foster that culture of communication and treat transportation with the same analytical integrity they apply to other aspects of patient flow can turn a source of friction into one of their powerful tools for accelerating throughput.

Chrisna Govin is the Chief Customer Officer at Roundtrip. She formerly lead the Product Design, Product Management and Product Marketing functions. Chrisna now drives aspects of Roundtrip’s product vision, strategy, and roadmap, while also owning the design and delivery of all customer experiences across the entire customer journey. Her experiences range from strategy and go-to-market design of products to strategic planning, partnerships, organization transformation and acquisition-integration leadership of corporations. Chrisna has a JD/MBA from Indiana University and received her BS in Biomedical Engineering at the University of Rochester.